


Stripping Advanced Stats Down To Find What Actually Impacts Goals
Analyzing advanced is becoming a bit too much. What shines through when we take away all the fluff?

I’ve become a bit tired of advanced stats this season. They’re becoming more-and-more separated from real, tangible results. It’s confusing to say “Player X is the best because of stat Y” when those roots to actual outcomes aren’t defined. And no matter how many stats we create, or strings we tie between possession, passing, zones… and actual results - there is no getting around the simple fact that goals are the only concrete result in hockey. If you want to win games, you have to put the puck in the back of the net more than the other team - there is no other way to do it.
Not all advanced stats are rooted in that truth. In my frustrations with dealing with that, I’ve been driven to find what stat does actually impact the goals a player’s team scores. In one value (or one stat), how can we see who best impacts the goals his team earns?
The result of that drive has ended up somewhere in left field, but the end product nonetheless brings up interesting discussions about stat adjustments, which players are best (how fun), and how advanced stats may overestimate some and underestimate others. I don’t promise that these thoughts are laid out clean, or rinsed of any dirty or lazy quick math. But if you’ll indulge me, let’s build something that tries to answer our question.
* Before we dive in - while the basis of our argument will be rooted in 2008-2024 data, the actual player data and player cards shared later will only be from 2024-25. ‘Tis the busy season, and we can call the missing historical data a reason to follow-up later.
Finding Our Stats
So, what was the process? Well the absolutely fantastic MoneyPuck.com makes their treasure trove of data incredibly accessible (seriously, check it out), giving us all of the team and individual numbers we need. I started by downloading and cleaning/organizing all data from 2008 to 2024, sifting and filtering where you’d expect. Then, quite simply, I mapped the correlation between every single stat and actual goals scored. At a team level, that was directly relating stats to total goals, and for players it was relating stats to on-ice goals.
Before we dive into the results, let’s quickly study some vocab. The most common stat adjustments are as follows - flurry adjustment (adjusting numbers to not count a flurry of low-slot jammings as 20 different high-danger chances); score & venue (adjusting for statistical biases from hand-tracking differences at every arena); and earned rebounds (adjusting for rebounds-created that didn’t result in another shot, only available for player stats). There’s various arguments for and against these adjustments, but I tend to trust them as significant and positive improvements to xG models. Our numbers here back that up - but it’s important to note that there may be reasonable bias at some level.
Okay, with that - we can look at our results:

Fair warning, all of these results are at even-strength (5v5). And not only do they line up with each other, they make a lot of sense. I’d say with this, we see two truths:
First, converting low-danger chances is more important than anything else, especially at a player level. That makes sense, high/medium-danger chances are more guaranteed (as we see w/ the team-level data), so players who can also convert low-danger chances score more than those who don’t.
Second, fully adjusted xGF are more telling than any other form of xGF - or, really, any other stat than those rooted in direct goals-scored. That makes sense, and it’s a nice kudos to MoneyPuck’s adjusting!
So, we’ve found our path forward. To find the true “best” (if that could ever be distinguished by just one number), we should look at On Ice Low-Danger Goals For and On Ice Flurry/Score/Rebound Adjusted xGF. This is where we’ll depart from historical data to 24-25 data, but let’s see what those two variables pull up.
Player Data
We’ll walk through my own process of adjusting the data in this section, refining it to be show rates, positional context, and team context. I won’t act like any of this is an exact process - more a mad science that I hope you’ll see the reason in when all is said and done. I’m gonna reference both stats a lot, so for ease let’s label On Ice Low-Danger Goals For as (LDGF) and fully adjusted xGF as (AxGF), and vice versa for goals against.
I started by downloading all 2024-25 player data, and isolating LDGF, AxGF, LDGA, and AxGA as the four variables in question. Since we’re in the dead middle of the season, we have to adjust into a rate value to fully level out all 574 players. We’ll do that by converting every stat to per-60 [ (stat/icetime)*60 ]. To keep those numbers from getting wonky, we’ll also cut out players with five-or-fewer games. The results:
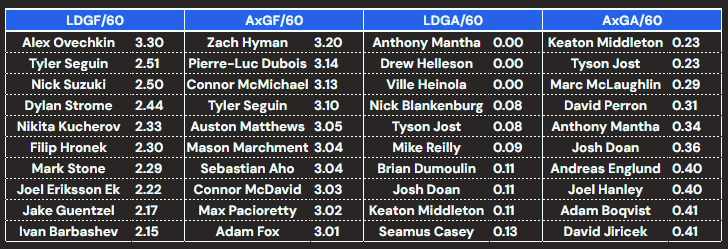
Fun stuff! Go Tampa Bay for having the best top-line in hockey. But I’ll tell ya what, raw data never feels properly telling. To turn it into something that actually shows how players pit against each other, I prefer using percentile rankings. Our next step will be converting these numbers into those.
Before we do, we have to take in two rules. First, percentiles have to be relative to position group (forward or defense). Second, we have to also consider time on ice, to help sift out the bottom-liners you see leading xGA stats - solely because little happens when fourth lines face fourth lines. So, our next process will be ranking each player’s per-GP tally accordingly.
The nice thing about leveling out things as percentiles is we can then very easily average out those percentages to simply show who performed the “best” across the four stats. You’ll see that new variable reflected in our new results:
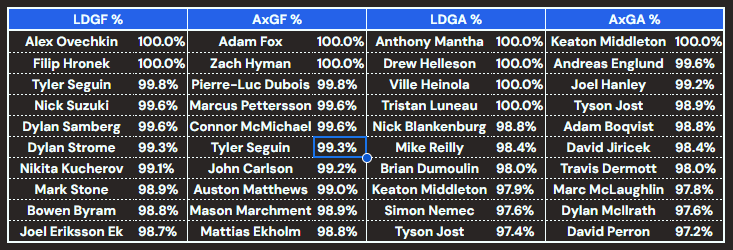
To be clear, these results show the percentile rank in each stat, relative to position group. So they’re fairly telling already. But to make them more meaningful, we need to include two more percentiles to act as refiners.
First, we’ll also rank players based on their total ice time. Better players tend to play more, and against harder competition, and including TOI totals is a good way to catch that context in a big net. We’ll also rank players on their current On-Ice Goals-For per-60. If we’re looking for something conducive to results, we have to include prior results too!
* I had also planned to include some seriously in-depth adjusting based on lineup data. MoneyPuck’s great data makes that information easy to access, but a whale to clean. And even though I undertook and completed the process of that cleaning, I was not blessed by the Excel heavens - and all of that data has been lost. Hooray.
Deep Breath
Okay, all of our percentiles and my confusing math is done. But our goal is not to find final percentiles - we want one holistic stat. With that in mind, our frankenstein stat includes:
LDGF/60
AxGF/60
LDGA/60
AxGA/60
Time on Ice/GP
On Ice GF/60
Before we share player info, let’s double check that our number actually correlates to goals scored. Our process will be to average out each percentile rank… below, we can see the correlation between that average and team goals scored, based on what we include:

Best case scenario! Not only does our created stat correlate, it correlates significantly more than any other stat (no scientists, I didn’t officially measure for the use of significant, but vibes). Here’s a glimpse at just how much of an improvement including prior results makes. On Ice Goals-For/60 is our X-axis here.
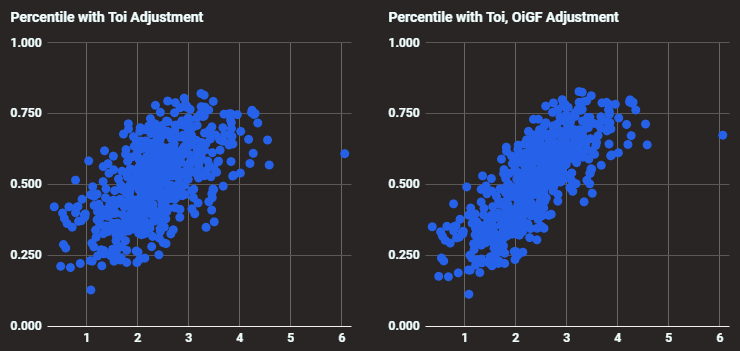
First off, shoutout Ovechkin for living on that island out right. Yes, he does slightly throw off our correlation info. But the tightening of these charts is great, and makes me confident that we have built something that truly rewards players who:
Convert low-danger chances
Generate high xG
Limit opponent’s low-danger conversion
Limit opponent xG
Play a lot of minutes
Are On-Ice for a lot of goals-for
Okay, I’ll stop reiterating the point. Long awaited, here are the top-30 and bottom-30 names in our new stat:

Some small takeaways from this: Alex Laferriere is carrying Los Angeles with an incredible breakout performance; Warren Foegele remains a fantastic middle-six glue guy; Nick Jensen is as shut-down as they come; and wow I hope Juuso Parssinen finds more footing in Colorado!
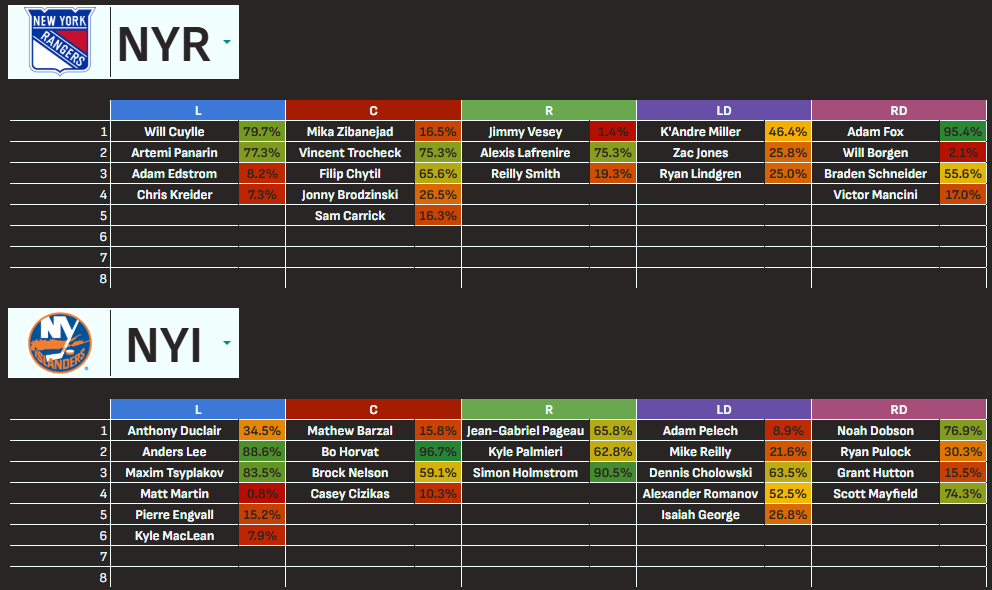
Now, here’s the fun part: I’ve built player cards and team cards featuring these stats. Even better, both cards have multiple options to compare between two players or teams. There’s still a lot of tweaks and changes I’ll want to eventually make, so this is certainly a V1, but nonetheless:
Here are some (very Metropolitan) examples!

* As always, normal spreadsheet rules apply. View only, please make a copy, if you want to see the data just ask me, etc.
** Double note, some oft-injured or low-ice time players had to be excluded. If your favorite player is missing, reach out and I’ll work to manually add him to these cards.
A Critique of Game Score
One final thing before I close this conversation, stripping advanced stats down to the bare bones also helps us find where Game Score overestimates players. I love Game Score - it’s a great stat - but there’s also only one commonly-accepted formula for it… which isn’t very scientific. Again, on-ice goals-for are the most tangible thing we have in hockey. Here’s how Game Score/60 correlates to On-Ice Goals-For/60:

We can see, there’s a fairly big discrepancy. Mapping out the two variables against each other shows the same story:
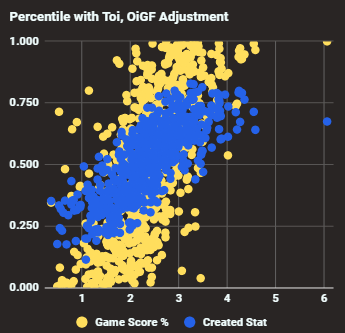
So, what is causing this discrepancy? To answer that, let’s look at what stats most correlate with On Ice Goals For (again) next to what most correlates with Game Score:

This is just a snippet of the overall correlation results, which spells out that game score overvalues individual stats, without taking on-ice stats into account. That makes sense given the availability of individual counts over on-ice counts, but it does slightly disadvantage players who support high-result lines without directly racking up the numbers themselves. Players most disadvantaged (low in game score, high in new stat) by this include Max Domi, Ryan Suter, Kaapo Kakko, Jake Walman, and Quinton Byfield. Players getting the best benefit from game score’s skew (high game score, low created stat) include Auston Matthews, Patrik Laine, Macklin Celebrini, and Kris Letang. Again, this skew rewards players for high individual counts without factoring in on ice results or how they support their teammates. Damn puck-hogs.
More seriously, call this game score section an excuse for further research. Incorporating game score into our created value actually hurts its correlation with on-ice goals-for, and my prior research on line data grew that discrepancy even further because it added more context to our created stat. With that spreadsheet now gone, we’ll have to wait until I get enough energy to recreate it before we can see what the true divide looks like.
If you’ve made it this far, thank you for your support. This was a whirlwind of a piece, and a lot of manic thinking about numbers, but I’d say it’s helped me get a better sense of where our current view of advanced stats overestimates, underestimates, or simply excludes player impact.
It’s all just thinkin’. It’s all just fun. If you enjoyed this piece, there will be more like it - so consider subscribing. If you have thoughts, I’d love to hear em. It’s a joy to get to talk about hockey, and I’m happy to do it with this community!