


Developing NHL Prospect Cards for 2024-25
You've seen the cards. Here's the low-down on how they're made and a link to your own spreadsheet.

What a whirlwind the last week has been. I shared out a new set of NHL prospect player cards last Wednesday that captured a lot of general advanced-stats, grouped into four categories: scoring, xG generation, off-puck, and transition. They were super popular, and amassed over 1.5M views/impressions on Twitter within just five days.
That is… insane. Or - insane by any standards I could set for myself. I’ve had a big boom on a few platforms, including here - so hello to the new members of this newsletter, we’re happy to have you here.
I won’t belabor any sort of point in this intro - and we’ll hold back from arduously walking through every single step in making the cards like in past articles. Let’s dive right into the high-level, get this public link out, then we can focus on some bumps in the carpet.
If you haven’t seen the player cards, here’s an example using a player that I’d slam my fists for in the first-round of the 2025 NHL Draft:
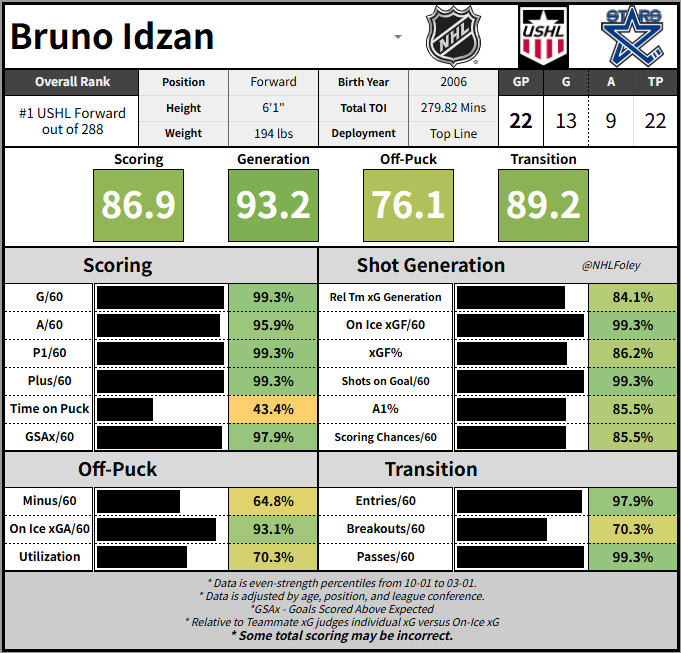
Bruno Idzan grades out as the #1 player in the USHL and the #8th best player in juniors. He deserves tremendous draft attention. He’d be the first natural Croatian ever drafted - and only the fourth player ever to get NHL drafted in the same year that they played Alps Hockey League games. Rockstar stuff.
Anyways, what’re we looking at in these cards? We’ll explain in order of priority, to better walk through how to read them. These cards shows the player’s percentile ranking in 18 different advanced stats at even-strength, represented by the black bars. What does percentile mean? The values in these stats (ie, 99.3% in G/60) shows the percent of the class ranked behind the player in that stat. A class is defined as all other players in the same position group (ie all forwards) and in the same league conference as the player (ie USHL Western Conference).
Adjusting values to conference rather than whole leagues is a very toolshed, but very practical way to adjust the data for schedule - which is frankly a must-have when working with NCAA data.
So now we know what (most of) the numbers are - but what are the stats? Here’s a quick table overview. This same table will be available on the cards below -
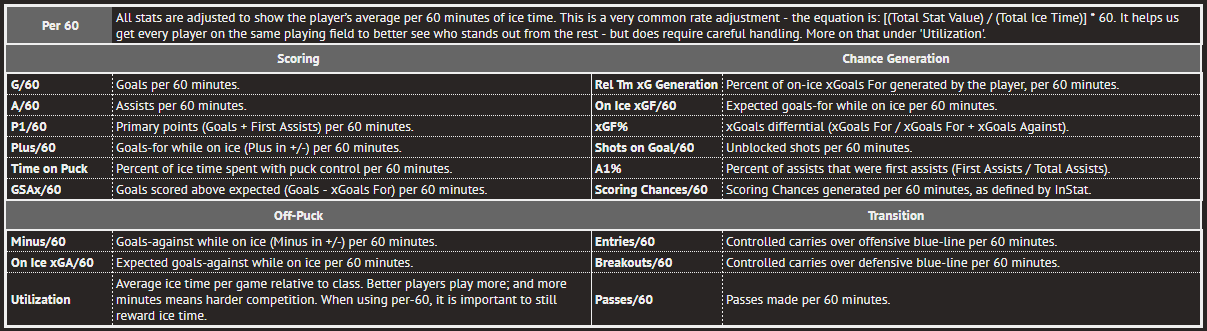
Great - this visual shows us what we’re working with. All stats are grouped into respective ‘stat categories’. The value shown at the top of the player cards show the average rank in each of these categories…
(Aside - Yes, this technically means Off-Puck and Transition give players a boost and the averages should be weighted. They’re not. If you feel passionately about that, let me know and we’ll get them weighted. Also, note the close correlation of many of these stats. We can fight those to some end, but I do not code - so we do give into the correlation to some end here. ¯\_(ツ)_/¯ y’know? )
Alright, now we know the big cards at the top are nothing more than the flat average of each category. But what about the overall rank in the top left? That’s a bit more drawn out:
To generate the overall rank, we first find the player’s average in the four stat categories. That average is then subtracted from the average for all players born in the same year, in the same league, and at the same position. That difference is then adjusted into a percentile, so that it can be incorporated into our overall rank.
That’s a lot of quick turns in the road, so let’s stick with Idzan to walk through that again:
Idzan’s average of four scoring categories - 0.862 *
Average of all USHL Forwards born in 2006 - 0.514
Idzan’s score above average - 0.348
Score above average percentile rank among all forwards - 0.995 *
Idzan’s overall rank math - 0.862 + 0.995 / 2
Idzan’s overall value - 0.929
Woo - more math. That overall value is then ranked against all other players in the same position group and league - so Idzan ranks first among all USHL forwards.
That was all pretty drawn out - but it is very important to walk through how we’re adjusting by age, and thus skewing the “model” for younger players. This has been the piece I’ve tinkered with most since I started posting cards. You get a better grip on the data as you share it out, as you write about it - and so minor tweaks have been made even as I was writing this article. That’s led to minor changes in the cards, but note that the only changes were to the ‘Overall Rank’ - all of the stat data has remained the same.
My justification for the age skew is simple - ideally every player will improve year over year, so a modestly-performing 17 year old is more valuable than a slightly better-performing 20 year old. We’re talking juniors here, you only get these players for a few years - finding the balance between room to grow, current impact, and age is the name of the game.
One finally component of the cards - total scoring is shown in the top-right. This is even-strength, empty-net-excluded scoring. And it is… really not perfect. I’ve noticed some big gaps in how that table is getting its data specifically. Part of that is because this data is from March 1st (which - keep that in mind! This will be updated soon). But even then, bleh. I haven’t noticed this influencing the per-60 stats, they seem correct - but… bleh, take note of the stars in the bottom of the card.
Alright… deep breath… now we know everything on these cards! They show you a very, very general (and fairly assumed) player value - based on how they outperform other players their age, in their league, and in their position in various Scoring, Generation, Off-Puck, and Transition stats. These cards are far, far, far from perfect. But they’re a great visual of info that’s often very hard to come by at this scale. They’re not perfect as a straight determiner of value, but they are a strong storytelling tool - and the array of stats we’ve got does well at showing the 200-foot, on-puck impact each player makes.
Alright, now we can get to what y’all are probably here for. I have created a public spreadsheet where you can few the full cards - that is, every player from the USHL, CHL, and NCAA - on your own. Go ahead and visit the link below, make a copy of the sheet, and have at it. I’ve watermarked the cards and ask that doesn’t be removed, for obvious reasons - but otherwise I’m excited to take my first stab at sharing out what is ultimately a massive sheet (4,000 players with nearly 40 stats each!).
Now I do want to share some caveats. This sheet does not actively include the AHL. I’m working on adding it in - follow on Twitter for updates - but it’s been very tough finding AHL transition data, and I don’t want to deliver something half-baked out the gates. We’ll see what we can add in… I may have to resort to unique cards for AHLers.
Another note - I’ve had many ask about paying me for these cards. I don’t plan to charge for any data that I’m sharing out generally - paid journalism has always felt like a juxtaposition. With that said, I have set up a ‘Buy Me A Coffee’ where you can chip in a couple bucks if you’re feeling particularly generous:
Finally… thank you all. This has been a ton of fun, these cards are a great technical test for me, and I only expect to do more… to do bigger, as the year drags on. I’ll have 2025 NHL Draft rankings up after the U18s, and plenty more content up on this newsletter very soon. To that end - one more button - make sure to subscribe!
For any questions, for tips on how to improve, for thoughts or general convo… I encourage everyone to connect. My Twitter DMs are always open. My email is gabrielmfoley@gmail.com. We’re all in this hockey world together, and it’s always fun to talk shop. Thanks everyone - ‘til next time!